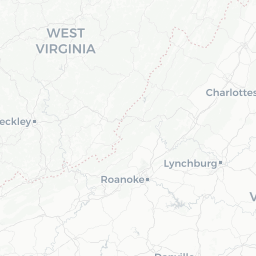
State Senate District 3
Valley
Partisan Lean of SD3 voters
Based on 2021 Governor's Race
Results are based on estimated absentee votes.
Details
The state Department of Elections does not publish results by state legislative district. VPAP has developed what it believes to be reasonable estimates for calcuating the results by legislative district.
Methodology
| Candidate | Votes | Percent Reporting |
|---|---|---|
|
Republican Candidate
Glenn Youngkin
|
62,124 | 68.14% |
|
Democrat Candidate
Terry McAuliffe
|
28,415 | 31.17% |
|
Liberation Party Candidate
Princess Blanding
|
561 | 0.62% |
Election-Day Ballots Mapped by Precinct
The results on this map are incomplete and do not include an estimated 30,378 early ballots.
Leaflet © OpenStreetMap | Map tiles by Carto
>+20D
0 to +20D
0 to +20R
>+20R
Alleghany County
Election Day Votes: 84.1%
Early In-Person Votes: 10.7%
Mail Ballots: 5.2%
| Candidate | Votes | Percent Reporting |
|---|---|---|
| Youngkin | 4,530 | 74.52% |
| McAuliffe | 1,518 | 24.97% |
| Blanding | 26 | 0.43% |
Actual
results for Alleghany County.
Methodology
SD3 includes all of Alleghany County, making it possible to get accurate gubernatorial results for that portion of the district.
These are actual results for SD3.
| Candidate | Votes | Percent Reporting |
|---|---|---|
| Youngkin | 396 | 60.74% |
| McAuliffe | 253 | 38.80% |
| Blanding | 3 | 0.46% |
These are actual results for SD3.
| Candidate | Votes | Percent Reporting |
|---|---|---|
| McAuliffe | 204 | 64.35% |
| Youngkin | 108 | 34.07% |
| Blanding | 5 | 1.58% |
Disclaimer: Precinct results shown below include only ballots on Election Day and do not include early ballots, which generally are more heavily weighted with Democrats.
Results limited to in-person votes cast on Election-Day.
| Candidate | Votes | Percent Reporting |
|---|---|---|
| Youngkin | 461 | 85.21% |
| McAuliffe | 77 | 14.23% |
| Blanding | 3 | 0.55% |
Results limited to in-person votes cast on Election-Day.
| Candidate | Votes | Percent Reporting |
|---|---|---|
| Youngkin | 181 | 88.29% |
| McAuliffe | 23 | 11.22% |
| Blanding | 1 | 0.49% |
Results limited to in-person votes cast on Election-Day.
| Candidate | Votes | Percent Reporting |
|---|---|---|
| Youngkin | 260 | 84.97% |
| McAuliffe | 45 | 14.71% |
| Blanding | 1 | 0.33% |
Results limited to in-person votes cast on Election-Day.
| Candidate | Votes | Percent Reporting |
|---|---|---|
| Youngkin | 321 | 82.31% |
| McAuliffe | 65 | 16.67% |
| Blanding | 1 | 0.26% |
Results limited to in-person votes cast on Election-Day.
| Candidate | Votes | Percent Reporting |
|---|---|---|
| Youngkin | 294 | 90.74% |
| McAuliffe | 29 | 8.95% |
| Blanding | 1 | 0.31% |
Results limited to in-person votes cast on Election-Day.
| Candidate | Votes | Percent Reporting |
|---|---|---|
| Youngkin | 442 | 80.66% |
| McAuliffe | 105 | 19.16% |
| Blanding | 1 | 0.18% |
Results limited to in-person votes cast on Election-Day.
| Candidate | Votes | Percent Reporting |
|---|---|---|
| Youngkin | 295 | 81.49% |
| McAuliffe | 67 | 18.51% |
| Blanding | 0 | 0.00% |
Results limited to in-person votes cast on Election-Day.
| Candidate | Votes | Percent Reporting |
|---|---|---|
| Youngkin | 359 | 81.41% |
| McAuliffe | 82 | 18.59% |
| Blanding | 0 | 0.00% |
Results limited to in-person votes cast on Election-Day.
| Candidate | Votes | Percent Reporting |
|---|---|---|
| Youngkin | 147 | 70.67% |
| McAuliffe | 59 | 28.37% |
| Blanding | 2 | 0.96% |
Results limited to in-person votes cast on Election-Day.
| Candidate | Votes | Percent Reporting |
|---|---|---|
| Youngkin | 530 | 82.81% |
| McAuliffe | 106 | 16.56% |
| Blanding | 2 | 0.31% |
Results limited to in-person votes cast on Election-Day.
| Candidate | Votes | Percent Reporting |
|---|---|---|
| Youngkin | 462 | 66.86% |
| McAuliffe | 228 | 33.00% |
| Blanding | 1 | 0.14% |
Results limited to in-person votes cast on Election-Day.
| Candidate | Votes | Percent Reporting |
|---|---|---|
| Youngkin | 274 | 60.35% |
| McAuliffe | 175 | 38.55% |
| Blanding | 5 | 1.10% |
Augusta County
Election Day Votes: 69.5%
Early In-Person Votes: 24.6%
Mail Ballots: 5.9%
| Candidate | Votes | Percent Reporting |
|---|---|---|
| Youngkin | 10,040 | 78.01% |
| McAuliffe | 2,773 | 21.55% |
| Blanding | 50 | 0.39% |
Estimated
results for Augusta County.
Methodology
Augusta County set up ballots in November 2021 in a way that made it impossible to allocate absentee ballots back to precincts where voters live. That required VPAP to estimate how absentee votes were distributed in the portion of Augusta County that falls within SD3.
These are estimated results.
Methodology
| Candidate | Votes | Percent Reporting |
|---|---|---|
| Youngkin | 2,279 | 71.89% |
| McAuliffe | 883 | 27.85% |
| Blanding | 6 | 0.19% |
These are estimated results.
Methodology
| Candidate | Votes | Percent Reporting |
|---|---|---|
| McAuliffe | 406 | 53.42% |
| Youngkin | 349 | 45.92% |
| Blanding | 4 | 0.53% |
Disclaimer: Precinct results shown below include only ballots on Election Day and do not include early ballots, which generally are more heavily weighted with Democrats.
Results limited to in-person votes cast on Election-Day.
| Candidate | Votes | Percent Reporting |
|---|---|---|
| Youngkin | 454 | 78.28% |
| McAuliffe | 123 | 21.21% |
| Blanding | 3 | 0.52% |
Results limited to in-person votes cast on Election-Day.
| Candidate | Votes | Percent Reporting |
|---|---|---|
| Youngkin | 563 | 76.39% |
| McAuliffe | 167 | 22.66% |
| Blanding | 6 | 0.81% |
Results limited to in-person votes cast on Election-Day.
| Candidate | Votes | Percent Reporting |
|---|---|---|
| Youngkin | 643 | 78.22% |
| McAuliffe | 177 | 21.53% |
| Blanding | 2 | 0.24% |
Results limited to in-person votes cast on Election-Day.
| Candidate | Votes | Percent Reporting |
|---|---|---|
| Youngkin | 1,004 | 86.18% |
| McAuliffe | 157 | 13.48% |
| Blanding | 3 | 0.26% |
Results limited to in-person votes cast on Election-Day.
| Candidate | Votes | Percent Reporting |
|---|---|---|
| Youngkin | 614 | 86.36% |
| McAuliffe | 93 | 13.08% |
| Blanding | 4 | 0.56% |
Results limited to in-person votes cast on Election-Day.
| Candidate | Votes | Percent Reporting |
|---|---|---|
| Youngkin | 945 | 86.38% |
| McAuliffe | 144 | 13.16% |
| Blanding | 5 | 0.46% |
Results limited to in-person votes cast on Election-Day.
| Candidate | Votes | Percent Reporting |
|---|---|---|
| Youngkin | 782 | 84.82% |
| McAuliffe | 137 | 14.86% |
| Blanding | 3 | 0.33% |
Results limited to in-person votes cast on Election-Day.
| Candidate | Votes | Percent Reporting |
|---|---|---|
| Youngkin | 1,462 | 85.05% |
| McAuliffe | 248 | 14.43% |
| Blanding | 7 | 0.41% |
Results limited to in-person votes cast on Election-Day.
| Candidate | Votes | Percent Reporting |
|---|---|---|
| Youngkin | 945 | 79.41% |
| McAuliffe | 238 | 20.00% |
| Blanding | 7 | 0.59% |
Botetourt County
Election Day Votes: 67.0%
Early In-Person Votes: 26.9%
Mail Ballots: 6.1%
| Candidate | Votes | Percent Reporting |
|---|---|---|
| Youngkin | 13,063 | 76.29% |
| McAuliffe | 3,990 | 23.30% |
| Blanding | 62 | 0.36% |
Actual
results for Botetourt County.
Methodology
SD3 includes all of Botetourt County, making it possible to get accurate gubernatorial results for that portion of the district.
These are actual results for SD3.
| Candidate | Votes | Percent Reporting |
|---|---|---|
| Youngkin | 3,182 | 69.13% |
| McAuliffe | 1,414 | 30.72% |
| Blanding | 6 | 0.13% |
These are actual results for SD3.
| Candidate | Votes | Percent Reporting |
|---|---|---|
| McAuliffe | 568 | 54.62% |
| Youngkin | 458 | 44.04% |
| Blanding | 12 | 1.15% |
Disclaimer: Precinct results shown below include only ballots on Election Day and do not include early ballots, which generally are more heavily weighted with Democrats.
Results limited to in-person votes cast on Election-Day.
| Candidate | Votes | Percent Reporting |
|---|---|---|
| Youngkin | 969 | 77.21% |
| McAuliffe | 281 | 22.39% |
| Blanding | 4 | 0.32% |
Results limited to in-person votes cast on Election-Day.
| Candidate | Votes | Percent Reporting |
|---|---|---|
| Youngkin | 1,082 | 83.81% |
| McAuliffe | 203 | 15.72% |
| Blanding | 5 | 0.39% |
Results limited to in-person votes cast on Election-Day.
| Candidate | Votes | Percent Reporting |
|---|---|---|
| Youngkin | 1,059 | 82.67% |
| McAuliffe | 217 | 16.94% |
| Blanding | 5 | 0.39% |
Results limited to in-person votes cast on Election-Day.
| Candidate | Votes | Percent Reporting |
|---|---|---|
| Youngkin | 1,031 | 81.50% |
| McAuliffe | 230 | 18.18% |
| Blanding | 4 | 0.32% |
Results limited to in-person votes cast on Election-Day.
| Candidate | Votes | Percent Reporting |
|---|---|---|
| Youngkin | 936 | 85.40% |
| McAuliffe | 157 | 14.32% |
| Blanding | 3 | 0.27% |
Results limited to in-person votes cast on Election-Day.
| Candidate | Votes | Percent Reporting |
|---|---|---|
| Youngkin | 848 | 82.73% |
| McAuliffe | 169 | 16.49% |
| Blanding | 7 | 0.68% |
Results limited to in-person votes cast on Election-Day.
| Candidate | Votes | Percent Reporting |
|---|---|---|
| Youngkin | 642 | 85.26% |
| McAuliffe | 104 | 13.81% |
| Blanding | 7 | 0.93% |
Results limited to in-person votes cast on Election-Day.
| Candidate | Votes | Percent Reporting |
|---|---|---|
| Youngkin | 1,083 | 84.48% |
| McAuliffe | 197 | 15.37% |
| Blanding | 2 | 0.16% |
Results limited to in-person votes cast on Election-Day.
| Candidate | Votes | Percent Reporting |
|---|---|---|
| Youngkin | 671 | 82.13% |
| McAuliffe | 144 | 17.63% |
| Blanding | 1 | 0.12% |
Results limited to in-person votes cast on Election-Day.
| Candidate | Votes | Percent Reporting |
|---|---|---|
| Youngkin | 1,102 | 77.93% |
| McAuliffe | 306 | 21.64% |
| Blanding | 6 | 0.42% |
Buena Vista City
Election Day Votes: 63.0%
Early In-Person Votes: 29.1%
Mail Ballots: 7.8%
| Candidate | Votes | Percent Reporting |
|---|---|---|
| Youngkin | 1,458 | 74.31% |
| McAuliffe | 481 | 24.52% |
| Blanding | 22 | 1.12% |
Actual
results for Buena Vista City.
Methodology
SD3 includes all of Buena Vista City, making it possible to get accurate gubernatorial results for that portion of the district.
These are actual results for SD3.
| Candidate | Votes | Percent Reporting |
|---|---|---|
| Youngkin | 388 | 67.95% |
| McAuliffe | 182 | 31.87% |
| Blanding | 1 | 0.18% |
These are actual results for SD3.
| Candidate | Votes | Percent Reporting |
|---|---|---|
| McAuliffe | 94 | 61.04% |
| Youngkin | 55 | 35.71% |
| Blanding | 5 | 3.25% |
Disclaimer: Precinct results shown below include only ballots on Election Day and do not include early ballots, which generally are more heavily weighted with Democrats.
Results limited to in-person votes cast on Election-Day.
| Candidate | Votes | Percent Reporting |
|---|---|---|
| Youngkin | 590 | 82.87% |
| McAuliffe | 112 | 15.73% |
| Blanding | 9 | 1.26% |
Results limited to in-person votes cast on Election-Day.
| Candidate | Votes | Percent Reporting |
|---|---|---|
| Youngkin | 425 | 80.95% |
| McAuliffe | 93 | 17.71% |
| Blanding | 7 | 1.33% |
Covington City
Election Day Votes: 79.6%
Early In-Person Votes: 0.0%
Mail Ballots: 20.4%
| Candidate | Votes | Percent Reporting |
|---|---|---|
| Youngkin | 1,198 | 66.82% |
| McAuliffe | 579 | 32.29% |
| Blanding | 16 | 0.89% |
Actual
results for Covington City.
Methodology
SD3 includes all of Covington City, making it possible to get accurate gubernatorial results for that portion of the district.
These are actual results for SD3.
| Candidate | Votes | Percent Reporting |
|---|---|---|
| Youngkin | 0 | 0.00% |
| Blanding | 0 | 0.00% |
| McAuliffe | 0 | 0.00% |
These are actual results for SD3.
| Candidate | Votes | Percent Reporting |
|---|---|---|
| McAuliffe | 186 | 50.82% |
| Youngkin | 174 | 47.54% |
| Blanding | 6 | 1.64% |
Disclaimer: Precinct results shown below include only ballots on Election Day and do not include early ballots, which generally are more heavily weighted with Democrats.
Results limited to in-person votes cast on Election-Day.
| Candidate | Votes | Percent Reporting |
|---|---|---|
| Youngkin | 163 | 70.87% |
| McAuliffe | 66 | 28.70% |
| Blanding | 1 | 0.43% |
Results limited to in-person votes cast on Election-Day.
| Candidate | Votes | Percent Reporting |
|---|---|---|
| Youngkin | 193 | 69.93% |
| McAuliffe | 83 | 30.07% |
| Blanding | 0 | 0.00% |
Results limited to in-person votes cast on Election-Day.
| Candidate | Votes | Percent Reporting |
|---|---|---|
| Youngkin | 91 | 50.00% |
| McAuliffe | 88 | 48.35% |
| Blanding | 3 | 1.65% |
Results limited to in-person votes cast on Election-Day.
| Candidate | Votes | Percent Reporting |
|---|---|---|
| Youngkin | 277 | 77.81% |
| McAuliffe | 75 | 21.07% |
| Blanding | 4 | 1.12% |
Results limited to in-person votes cast on Election-Day.
| Candidate | Votes | Percent Reporting |
|---|---|---|
| Youngkin | 300 | 78.33% |
| McAuliffe | 81 | 21.15% |
| Blanding | 2 | 0.52% |
Craig County
Election Day Votes: 77.6%
Early In-Person Votes: 18.7%
Mail Ballots: 3.7%
| Candidate | Votes | Percent Reporting |
|---|---|---|
| Youngkin | 2,079 | 83.16% |
| McAuliffe | 400 | 16.00% |
| Blanding | 17 | 0.68% |
Actual
results for Craig County.
Methodology
SD3 includes all of Craig County, making it possible to get accurate gubernatorial results for that portion of the district.
These are actual results for SD3.
| Candidate | Votes | Percent Reporting |
|---|---|---|
| Youngkin | 377 | 80.73% |
| McAuliffe | 85 | 18.20% |
| Blanding | 4 | 0.86% |
These are actual results for SD3.
| Candidate | Votes | Percent Reporting |
|---|---|---|
| Youngkin | 46 | 49.46% |
| McAuliffe | 46 | 49.46% |
| Blanding | 1 | 1.08% |
Disclaimer: Precinct results shown below include only ballots on Election Day and do not include early ballots, which generally are more heavily weighted with Democrats.
Results limited to in-person votes cast on Election-Day.
| Candidate | Votes | Percent Reporting |
|---|---|---|
| Youngkin | 286 | 86.93% |
| McAuliffe | 41 | 12.46% |
| Blanding | 2 | 0.61% |
Results limited to in-person votes cast on Election-Day.
| Candidate | Votes | Percent Reporting |
|---|---|---|
| Youngkin | 381 | 89.23% |
| McAuliffe | 42 | 9.84% |
| Blanding | 2 | 0.47% |
Results limited to in-person votes cast on Election-Day.
| Candidate | Votes | Percent Reporting |
|---|---|---|
| Youngkin | 224 | 80.00% |
| McAuliffe | 53 | 18.93% |
| Blanding | 3 | 1.07% |
Results limited to in-person votes cast on Election-Day.
| Candidate | Votes | Percent Reporting |
|---|---|---|
| Youngkin | 164 | 81.59% |
| McAuliffe | 34 | 16.92% |
| Blanding | 3 | 1.49% |
Results limited to in-person votes cast on Election-Day.
| Candidate | Votes | Percent Reporting |
|---|---|---|
| Youngkin | 148 | 82.68% |
| McAuliffe | 28 | 15.64% |
| Blanding | 2 | 1.12% |
Results limited to in-person votes cast on Election-Day.
| Candidate | Votes | Percent Reporting |
|---|---|---|
| Youngkin | 25 | 75.76% |
| McAuliffe | 8 | 24.24% |
| Blanding | 0 | 0.00% |
Results limited to in-person votes cast on Election-Day.
| Candidate | Votes | Percent Reporting |
|---|---|---|
| Youngkin | 150 | 84.75% |
| McAuliffe | 27 | 15.25% |
| Blanding | 0 | 0.00% |
Results limited to in-person votes cast on Election-Day.
| Candidate | Votes | Percent Reporting |
|---|---|---|
| Youngkin | 278 | 88.54% |
| McAuliffe | 36 | 11.46% |
| Blanding | 0 | 0.00% |
Lexington City
Election Day Votes: 47.3%
Early In-Person Votes: 42.5%
Mail Ballots: 10.2%
| Candidate | Votes | Percent Reporting |
|---|---|---|
| McAuliffe | 1,281 | 61.91% |
| Youngkin | 774 | 37.41% |
| Blanding | 10 | 0.48% |
Actual
results for Lexington City.
Methodology
SD3 includes all of Lexington City, making it possible to get accurate gubernatorial results for that portion of the district.
These are actual results for SD3.
| Candidate | Votes | Percent Reporting |
|---|---|---|
| McAuliffe | 609 | 69.28% |
| Youngkin | 270 | 30.72% |
| Blanding | 0 | 0.00% |
These are actual results for SD3.
| Candidate | Votes | Percent Reporting |
|---|---|---|
| McAuliffe | 177 | 83.49% |
| Youngkin | 30 | 14.15% |
| Blanding | 5 | 2.36% |
Disclaimer: Precinct results shown below include only ballots on Election Day and do not include early ballots, which generally are more heavily weighted with Democrats.
Results limited to in-person votes cast on Election-Day.
| Candidate | Votes | Percent Reporting |
|---|---|---|
| McAuliffe | 495 | 50.61% |
| Youngkin | 474 | 48.47% |
| Blanding | 5 | 0.51% |
Roanoke County
Election Day Votes: 64.5%
Early In-Person Votes: 27.7%
Mail Ballots: 7.8%
| Candidate | Votes | Percent Reporting |
|---|---|---|
| Youngkin | 12,979 | 67.71% |
| McAuliffe | 6,071 | 31.67% |
| Blanding | 97 | 0.51% |
Estimated
results for Roanoke County.
Methodology
Roanoke County contains "split" precincts (*) for SD3.
Explain
Roanoke County set up ballots in November 2021 in a way that made it impossible to allocate absentee ballots back to precincts where voters live. That required VPAP to estimate how absentee votes were distributed in the portion of Roanoke County that falls within SD3.
These are estimated results.
Methodology
| Candidate | Votes | Percent Reporting |
|---|---|---|
| Youngkin | 3,372 | 63.46% |
| McAuliffe | 1,926 | 36.24% |
| Blanding | 15 | 0.28% |
These are estimated results.
Methodology
| Candidate | Votes | Percent Reporting |
|---|---|---|
| McAuliffe | 950 | 63.38% |
| Youngkin | 531 | 35.42% |
| Blanding | 14 | 0.93% |
Disclaimer: Precinct results shown below include only ballots on Election Day and do not include early ballots, which generally are more heavily weighted with Democrats.
Results limited to in-person votes cast on Election-Day.
| Candidate | Votes | Percent Reporting |
|---|---|---|
| Youngkin | 379 | 81.51% |
| McAuliffe | 81 | 17.42% |
| Blanding | 4 | 0.86% |
Results limited to in-person votes cast on Election-Day.
| Candidate | Votes | Percent Reporting |
|---|---|---|
| Youngkin | 345 | 80.80% |
| McAuliffe | 78 | 18.27% |
| Blanding | 4 | 0.94% |
Results limited to in-person votes cast on Election-Day.
| Candidate | Votes | Percent Reporting |
|---|---|---|
| Youngkin | 978 | 77.19% |
| McAuliffe | 286 | 22.57% |
| Blanding | 3 | 0.24% |
Results limited to in-person votes cast on Election-Day.
| Candidate | Votes | Percent Reporting |
|---|---|---|
| Youngkin | 431 | 65.20% |
| McAuliffe | 226 | 34.19% |
| Blanding | 4 | 0.61% |
Results limited to in-person votes cast on Election-Day.
| Candidate | Votes | Percent Reporting |
|---|---|---|
| Youngkin | 929 | 68.61% |
| McAuliffe | 419 | 30.95% |
| Blanding | 2 | 0.15% |
This is a "split" precinct.
Explain
Results limited to in-person votes cast on Election-Day.
| Candidate | Votes | Percent Reporting |
|---|---|---|
| Youngkin | 16 | 76.19% |
| McAuliffe | 4 | 19.05% |
| Blanding | 0 | 0.00% |
Results limited to in-person votes cast on Election-Day.
| Candidate | Votes | Percent Reporting |
|---|---|---|
| Youngkin | 435 | 79.09% |
| McAuliffe | 112 | 20.36% |
| Blanding | 3 | 0.55% |
Results limited to in-person votes cast on Election-Day.
| Candidate | Votes | Percent Reporting |
|---|---|---|
| Youngkin | 574 | 75.73% |
| McAuliffe | 177 | 23.35% |
| Blanding | 7 | 0.92% |
Results limited to in-person votes cast on Election-Day.
| Candidate | Votes | Percent Reporting |
|---|---|---|
| Youngkin | 611 | 70.80% |
| McAuliffe | 247 | 28.62% |
| Blanding | 4 | 0.46% |
Results limited to in-person votes cast on Election-Day.
| Candidate | Votes | Percent Reporting |
|---|---|---|
| Youngkin | 391 | 62.16% |
| McAuliffe | 230 | 36.57% |
| Blanding | 8 | 1.27% |
Results limited to in-person votes cast on Election-Day.
| Candidate | Votes | Percent Reporting |
|---|---|---|
| Youngkin | 1,022 | 72.90% |
| McAuliffe | 368 | 26.25% |
| Blanding | 9 | 0.64% |
Results limited to in-person votes cast on Election-Day.
| Candidate | Votes | Percent Reporting |
|---|---|---|
| Youngkin | 765 | 69.17% |
| McAuliffe | 330 | 29.84% |
| Blanding | 9 | 0.81% |
Results limited to in-person votes cast on Election-Day.
| Candidate | Votes | Percent Reporting |
|---|---|---|
| Youngkin | 1,024 | 77.11% |
| McAuliffe | 295 | 22.21% |
| Blanding | 7 | 0.53% |
Results limited to in-person votes cast on Election-Day.
| Candidate | Votes | Percent Reporting |
|---|---|---|
| Youngkin | 326 | 70.56% |
| McAuliffe | 135 | 29.22% |
| Blanding | 1 | 0.22% |
Results limited to in-person votes cast on Election-Day.
| Candidate | Votes | Percent Reporting |
|---|---|---|
| Youngkin | 235 | 75.81% |
| McAuliffe | 73 | 23.55% |
| Blanding | 1 | 0.32% |
Results limited to in-person votes cast on Election-Day.
| Candidate | Votes | Percent Reporting |
|---|---|---|
| Youngkin | 615 | 81.78% |
| McAuliffe | 134 | 17.82% |
| Blanding | 2 | 0.27% |
Rockbridge County
Election Day Votes: 71.6%
Early In-Person Votes: 22.4%
Mail Ballots: 6.0%
| Candidate | Votes | Percent Reporting |
|---|---|---|
| Youngkin | 6,903 | 68.93% |
| McAuliffe | 3,064 | 30.60% |
| Blanding | 40 | 0.40% |
Actual
results for Rockbridge County.
Methodology
SD3 includes all of Rockbridge County, making it possible to get accurate gubernatorial results for that portion of the district.
These are actual results for SD3.
| Candidate | Votes | Percent Reporting |
|---|---|---|
| Youngkin | 1,159 | 51.65% |
| McAuliffe | 1,078 | 48.04% |
| Blanding | 6 | 0.27% |
These are actual results for SD3.
| Candidate | Votes | Percent Reporting |
|---|---|---|
| McAuliffe | 407 | 67.72% |
| Youngkin | 186 | 30.95% |
| Blanding | 6 | 1.00% |
Disclaimer: Precinct results shown below include only ballots on Election Day and do not include early ballots, which generally are more heavily weighted with Democrats.
Results limited to in-person votes cast on Election-Day.
| Candidate | Votes | Percent Reporting |
|---|---|---|
| Youngkin | 391 | 69.70% |
| McAuliffe | 169 | 30.12% |
| Blanding | 1 | 0.18% |
Results limited to in-person votes cast on Election-Day.
| Candidate | Votes | Percent Reporting |
|---|---|---|
| Youngkin | 349 | 80.05% |
| McAuliffe | 85 | 19.50% |
| Blanding | 2 | 0.46% |
Results limited to in-person votes cast on Election-Day.
| Candidate | Votes | Percent Reporting |
|---|---|---|
| Youngkin | 244 | 83.85% |
| McAuliffe | 44 | 15.12% |
| Blanding | 2 | 0.69% |
Results limited to in-person votes cast on Election-Day.
| Candidate | Votes | Percent Reporting |
|---|---|---|
| Youngkin | 223 | 81.39% |
| McAuliffe | 51 | 18.61% |
| Blanding | 0 | 0.00% |
Results limited to in-person votes cast on Election-Day.
| Candidate | Votes | Percent Reporting |
|---|---|---|
| Youngkin | 280 | 75.88% |
| McAuliffe | 89 | 24.12% |
| Blanding | 0 | 0.00% |
Results limited to in-person votes cast on Election-Day.
| Candidate | Votes | Percent Reporting |
|---|---|---|
| Youngkin | 605 | 73.16% |
| McAuliffe | 218 | 26.36% |
| Blanding | 3 | 0.36% |
Results limited to in-person votes cast on Election-Day.
| Candidate | Votes | Percent Reporting |
|---|---|---|
| Youngkin | 134 | 66.67% |
| McAuliffe | 65 | 32.34% |
| Blanding | 2 | 1.00% |
Results limited to in-person votes cast on Election-Day.
| Candidate | Votes | Percent Reporting |
|---|---|---|
| Youngkin | 300 | 75.00% |
| McAuliffe | 95 | 23.75% |
| Blanding | 5 | 1.25% |
Results limited to in-person votes cast on Election-Day.
| Candidate | Votes | Percent Reporting |
|---|---|---|
| Youngkin | 393 | 82.91% |
| McAuliffe | 80 | 16.88% |
| Blanding | 1 | 0.21% |
Results limited to in-person votes cast on Election-Day.
| Candidate | Votes | Percent Reporting |
|---|---|---|
| Youngkin | 189 | 85.14% |
| McAuliffe | 33 | 14.86% |
| Blanding | 0 | 0.00% |
Results limited to in-person votes cast on Election-Day.
| Candidate | Votes | Percent Reporting |
|---|---|---|
| Youngkin | 414 | 76.52% |
| McAuliffe | 124 | 22.92% |
| Blanding | 3 | 0.55% |
Results limited to in-person votes cast on Election-Day.
| Candidate | Votes | Percent Reporting |
|---|---|---|
| Youngkin | 594 | 84.38% |
| McAuliffe | 108 | 15.34% |
| Blanding | 2 | 0.28% |
Results limited to in-person votes cast on Election-Day.
| Candidate | Votes | Percent Reporting |
|---|---|---|
| Youngkin | 231 | 87.83% |
| McAuliffe | 32 | 12.17% |
| Blanding | 0 | 0.00% |
Results limited to in-person votes cast on Election-Day.
| Candidate | Votes | Percent Reporting |
|---|---|---|
| Youngkin | 253 | 89.08% |
| McAuliffe | 27 | 9.51% |
| Blanding | 2 | 0.70% |
Results limited to in-person votes cast on Election-Day.
| Candidate | Votes | Percent Reporting |
|---|---|---|
| Youngkin | 281 | 66.90% |
| McAuliffe | 137 | 32.62% |
| Blanding | 2 | 0.48% |
Results limited to in-person votes cast on Election-Day.
| Candidate | Votes | Percent Reporting |
|---|---|---|
| Youngkin | 255 | 73.70% |
| McAuliffe | 90 | 26.01% |
| Blanding | 1 | 0.29% |
Results limited to in-person votes cast on Election-Day.
| Candidate | Votes | Percent Reporting |
|---|---|---|
| Youngkin | 422 | 75.90% |
| McAuliffe | 132 | 23.74% |
| Blanding | 2 | 0.36% |
Staunton City
Election Day Votes: 56.1%
Early In-Person Votes: 33.2%
Mail Ballots: 10.8%
| Candidate | Votes | Percent Reporting |
|---|---|---|
| McAuliffe | 4,995 | 51.20% |
| Youngkin | 4,634 | 47.50% |
| Blanding | 119 | 1.22% |
Actual
results for Staunton City.
Methodology
SD3 includes all of Staunton City, making it possible to get accurate gubernatorial results for that portion of the district.
These are actual results for SD3.
| Candidate | Votes | Percent Reporting |
|---|---|---|
| McAuliffe | 1,962 | 60.65% |
| Youngkin | 1,242 | 38.39% |
| Blanding | 28 | 0.87% |
These are actual results for SD3.
| Candidate | Votes | Percent Reporting |
|---|---|---|
| McAuliffe | 729 | 69.43% |
| Youngkin | 300 | 28.57% |
| Blanding | 19 | 1.81% |
Disclaimer: Precinct results shown below include only ballots on Election Day and do not include early ballots, which generally are more heavily weighted with Democrats.
Results limited to in-person votes cast on Election-Day.
| Candidate | Votes | Percent Reporting |
|---|---|---|
| Youngkin | 664 | 58.40% |
| McAuliffe | 451 | 39.67% |
| Blanding | 21 | 1.85% |
Results limited to in-person votes cast on Election-Day.
| Candidate | Votes | Percent Reporting |
|---|---|---|
| Youngkin | 827 | 65.58% |
| McAuliffe | 422 | 33.47% |
| Blanding | 12 | 0.95% |
Results limited to in-person votes cast on Election-Day.
| Candidate | Votes | Percent Reporting |
|---|---|---|
| Youngkin | 668 | 57.09% |
| McAuliffe | 480 | 41.03% |
| Blanding | 20 | 1.71% |
Results limited to in-person votes cast on Election-Day.
| Candidate | Votes | Percent Reporting |
|---|---|---|
| Youngkin | 517 | 53.30% |
| McAuliffe | 444 | 45.77% |
| Blanding | 9 | 0.93% |
Results limited to in-person votes cast on Election-Day.
| Candidate | Votes | Percent Reporting |
|---|---|---|
| McAuliffe | 507 | 54.34% |
| Youngkin | 416 | 44.59% |
| Blanding | 10 | 1.07% |
Waynesboro City
Election Day Votes: 59.8%
Early In-Person Votes: 28.3%
Mail Ballots: 11.9%
| Candidate | Votes | Percent Reporting |
|---|---|---|
| Youngkin | 4,466 | 56.99% |
| McAuliffe | 3,263 | 41.64% |
| Blanding | 102 | 1.30% |
Actual
results for Waynesboro City.
Methodology
SD3 includes all of Waynesboro City, making it possible to get accurate gubernatorial results for that portion of the district.
These are actual results for SD3.
| Candidate | Votes | Percent Reporting |
|---|---|---|
| Youngkin | 1,223 | 55.16% |
| McAuliffe | 980 | 44.20% |
| Blanding | 15 | 0.68% |
These are actual results for SD3.
| Candidate | Votes | Percent Reporting |
|---|---|---|
| McAuliffe | 636 | 68.09% |
| Youngkin | 280 | 29.98% |
| Blanding | 18 | 1.93% |
Disclaimer: Precinct results shown below include only ballots on Election Day and do not include early ballots, which generally are more heavily weighted with Democrats.
Results limited to in-person votes cast on Election-Day.
| Candidate | Votes | Percent Reporting |
|---|---|---|
| Youngkin | 475 | 61.29% |
| McAuliffe | 279 | 36.00% |
| Blanding | 19 | 2.45% |
Results limited to in-person votes cast on Election-Day.
| Candidate | Votes | Percent Reporting |
|---|---|---|
| Youngkin | 739 | 60.43% |
| McAuliffe | 471 | 38.51% |
| Blanding | 11 | 0.90% |
Results limited to in-person votes cast on Election-Day.
| Candidate | Votes | Percent Reporting |
|---|---|---|
| Youngkin | 718 | 62.76% |
| McAuliffe | 393 | 34.35% |
| Blanding | 30 | 2.62% |
Results limited to in-person votes cast on Election-Day.
| Candidate | Votes | Percent Reporting |
|---|---|---|
| Youngkin | 1,031 | 66.77% |
| McAuliffe | 504 | 32.64% |
| Blanding | 9 | 0.58% |
In order to calculate the number of votes within each precinct split between two or more districts, VPAP uses the proportion of voters within that portion of the precinct, which is provided by locality registrars on a monthly basis. If voter registration data is unavailable, for example when redistricting occurs, then VPAP will use the proportion of voting age population within that portion of the precinct, calculated using Census block-level data.
Source:
Virginia Department of Elections